Gain accurate insights into the adaptive immune response with our Advanced Data Analysis tools
Get the exploratory data you need to advance your clinical studies
Identifying specific changes in the immune response with respect to disease state or treatment can be challenging when analyzing highly diverse, bulk adaptive immune receptor repertoire (AIRR) sequencing data. You need access to advanced analytics that can cut through the noise and deliver clear, actionable data to advance your clinical program.
Maximize the impact of your clinical research with our
advanced data analytics tools
The adaptive immune receptor repertoire can provide valuable insights for disease biomarker development, vaccine and monoclonal antibody design, development and characterization of CAR-T cells and TILs, and much more. No matter your specific application, we have developed advanced AIRR analysis tools to provide comprehensive data to help you find answers to drive forward your clinical research programs.
Clonal Dynamics
This report shows the expanding and contracting of clones found for TRB for one individual after COVID vaccination using edgeR, with adjusted p-values and fold change for each clone.
B cell Analysis and
Somatic Hypermutation Analysis
Report that shows isotype (C-gene) usage of IgM, IgD, IgG, IgE, IgA, and isotype-related metrics, e.g., Class switch recombination (CSR) index and percentage of mutated and unmutated naïve IgD/IgM sequences will be derived from isotype mapping data. The Somatic hypermutations (SHM) score for each unique sequence in a repertoire will be calculated by measuring the percentage of mismatches (mutations) between a data sequence and its V reference. The mean of all sequences in a sample represents a repertoire’s SHM rate.
Diversity Metrics
This report provides a wide range of diversity analysis and metrics to capture the distribution of clonotypes of a sample and global changes in immune response, such as:
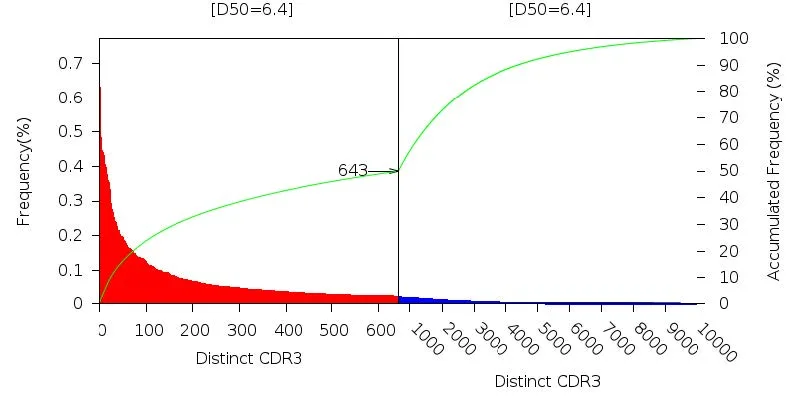
- D50 convergence*: Percentage of clones that make up the top 50% of the total reads or RNA expression. There is a direct relationship between D50 and diversity, with the most diverse library calculation being 50 and less diverse as 0.
- Shannon index*: Is a diversity index that incorporates the number of unique clones and their abundance. Shannon is more sensitive to the overall number of clonotypes than D50, particularly lower frequency clonotypes.
- Pielou's evenness: The Pielou index is a normalized Shannon index that describes the evenness of a TCR repertoire.
- Gini index: The Gini index measures equality of distribution and is positively correlated with T cell clonality.
- Inverse Simpson index: Is a measure of the effective number of types in a dataset. It's used to measure the diversity of unique T-cells and B-cells.
These various metrics increase confidence that the diversity is being appropriately measured, and differences may reflect nuances concerning the repertoire that would be masked otherwise.
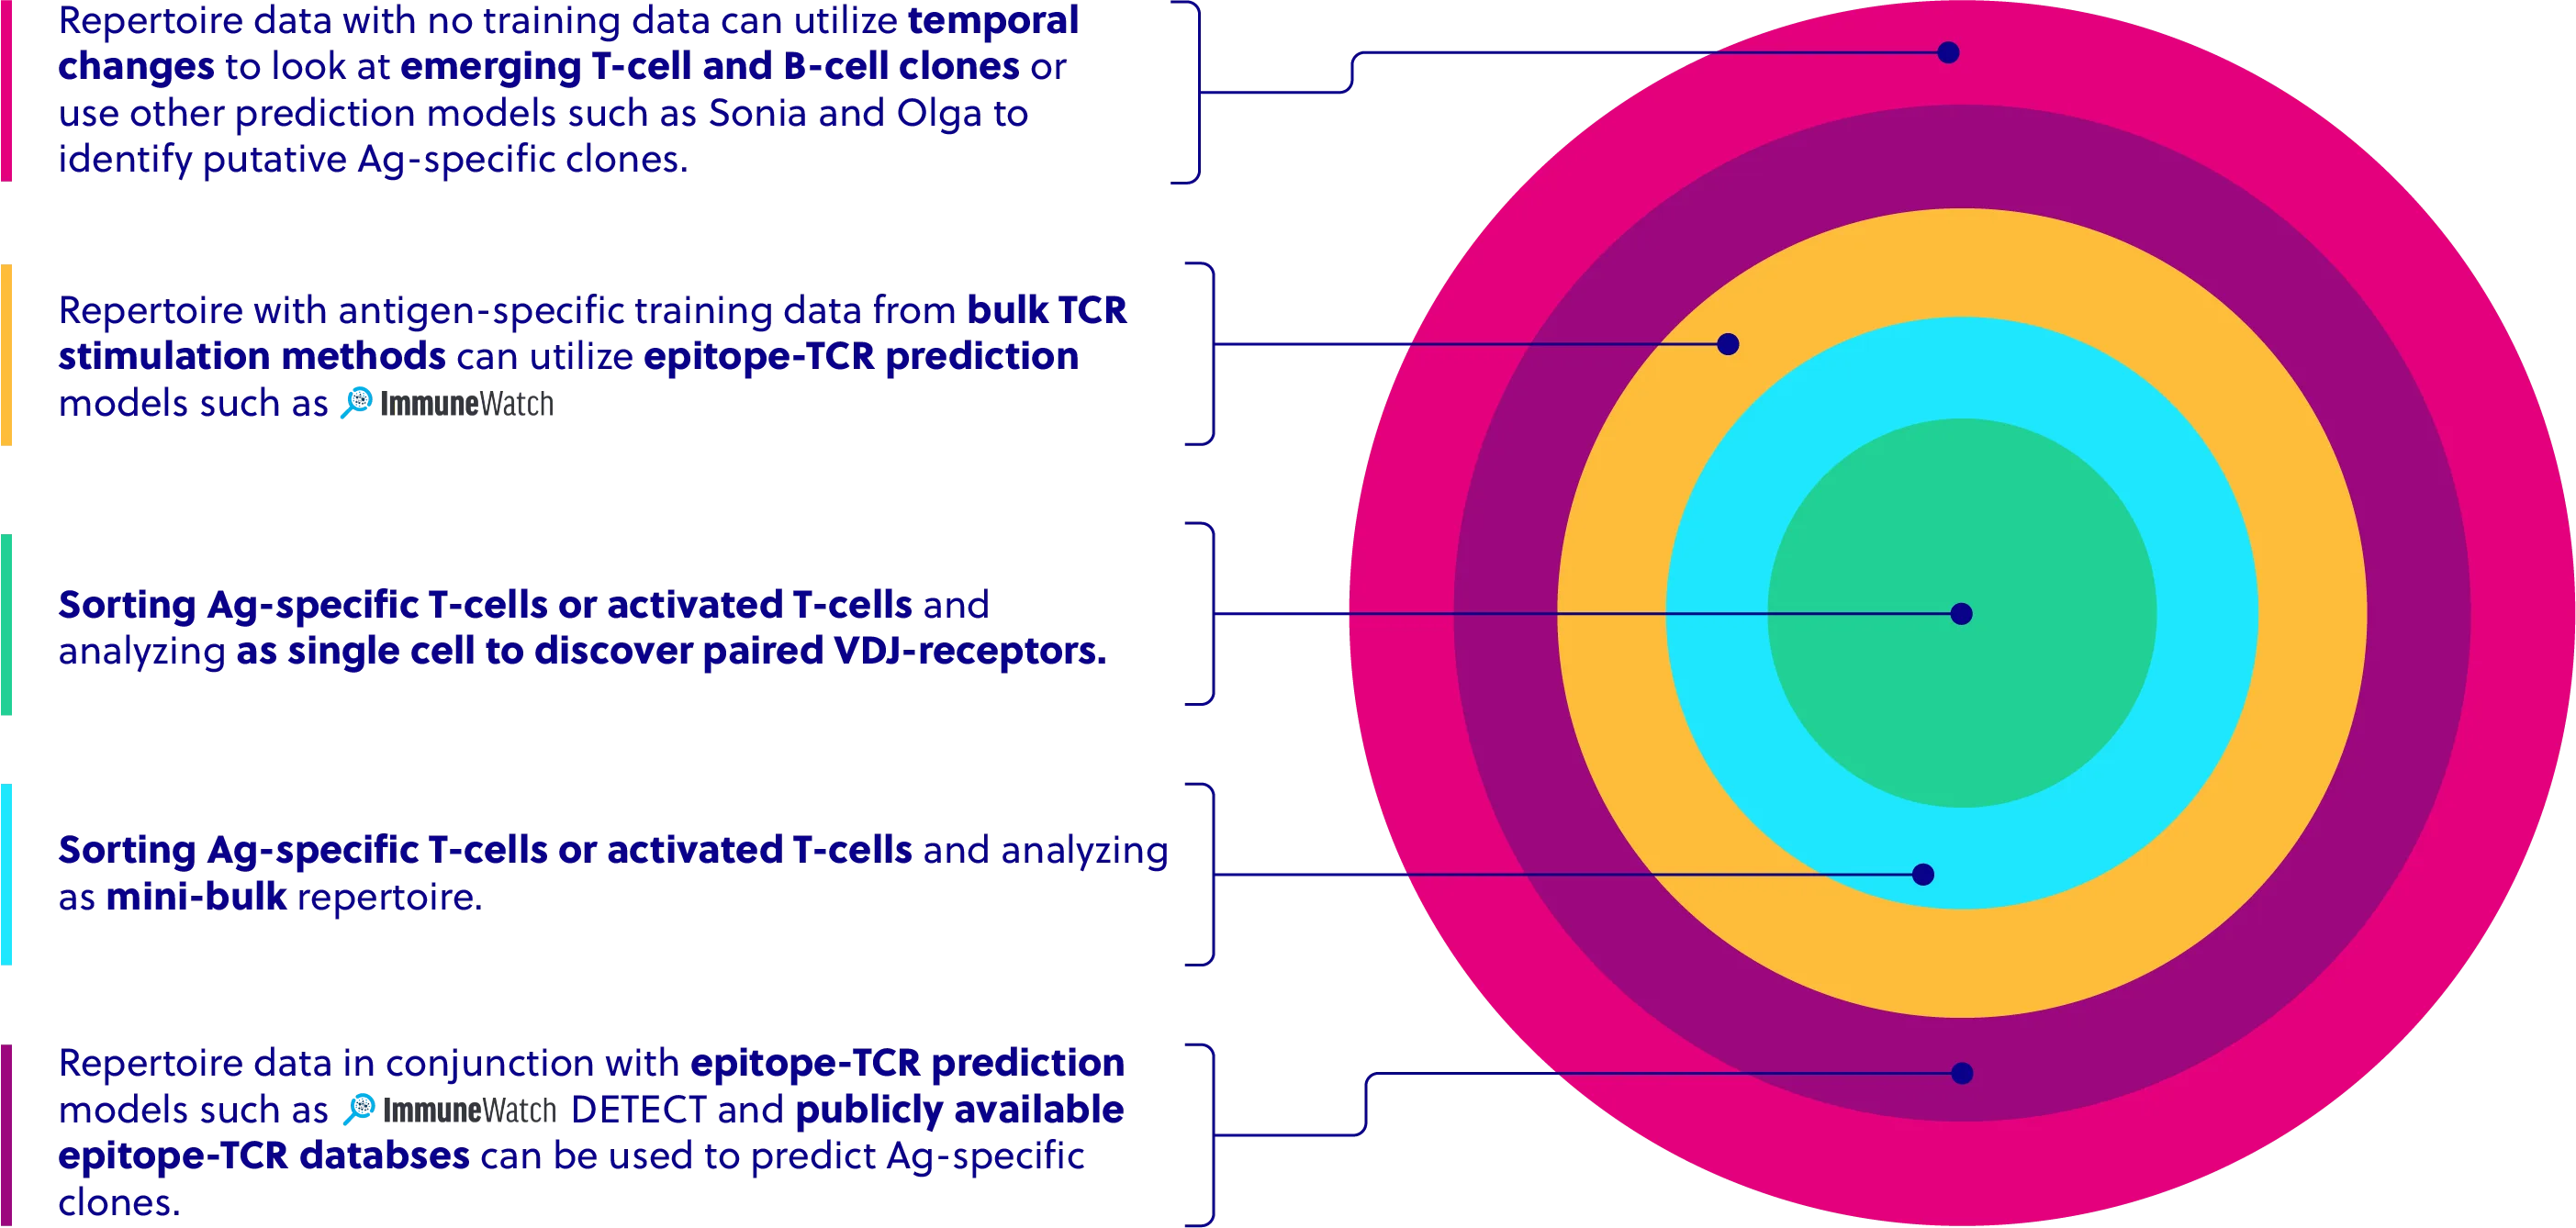
Antigen Specificity Analysis
New computational models allow for Ag-specific prediction of individual TCRs within repertoire datasets, particularly when training data specific to peptides is generated for a subset of patient samples.
Cohort Analysis for Gene Usage and Sequence Sharing
During exploratory analysis, observe differences between groups of samples by comparing the statistical relationship of pre-calculated data points to answer hypothesis-driven questions.

Customize your advanced analysis services
Our advanced data analysis services have built-in flexibility to meet your diverse AIRR analysis needs. Select from three service tiers to meet your specific analysis needs. Let’s discuss your project and how we can help get the most from your AIRR clinical studies.
| Tier 1 | Tier 2 | Tier 3 | |||||
|---|---|---|---|---|---|---|---|
| Additional diversity indices such as Gini index, Simpson index & eveness, Pielou's eveness, Hill diversity plots | |||||||
| Multi-chain tree maps with temporal clones color matched | |||||||
| Class-switch recombination (CSR) percentages | |||||||
| Expanded reporting tables | |||||||
| Somatic hypermutation (SHM) calculations | |||||||
| P-gen/Post-gen per uCDR3 generation probability scores predicting pre- or post- thymic selection | |||||||
| Summarized cumulative V-J percentage per sample | |||||||
| V-J chord diagrams | |||||||
| Cumulative summary tables (across batches) | |||||||
| HTML interactive style report | |||||||
| Group or Cohort analysis to identify potential trends or statistically significant signals | |||||||
Obtain clear, actionable results with our rigorous data processing pipeline
Feel confident about your adaptive immune sequencing data. Our data analysis tools deliver best-in-class data quality and accuracy by utilizing processes that include:
- Data demultiplexing and chain identification: Data is first demultiplexed from FASTQ files and chains are identified for further separation before the next step.
- UMI plus window condense filter: An algorithm identifies only the UMIs with the highest copy numbers.
- PCR error filtering: The filter removes indels and substitution errors caused by PCR.
- Data QC: Our bioinformaticians review all data, batch controls, and provide a detailed QC report.
Our standard data outputs, included in all of our analysis, provide comprehensive insights into the AIRR to advance your clinical programs
Our standard data outputs and reports include:
General outputs
- Alignments to the IMGT database
- Downloadable demultiplexed raw or filtered data
- Molecular ID/barcode sequencing decoding
CDR metrics
- CDR1, CDR2, and CDR3 identification
- The number of CDR3s captured in the library and the number of unique CDR3s within each sample
- CDR3 hierarchical peptide frequency mapping including class-switching for BCRs
- CDR3 peptide with V-J frequency lists
- CDR3 algebra: Different samples are scaled, so that the frequency of CDR3s can be compared across samples with differing read depths
The diversity of the immune repertoire in each sample, captured by a diversity index, a proprietary D50 value, and Shannon entropy
Identification of IgG, IgA, IgM, IgE, IgD
VDJ-C data
- Normalized and unnormalized distributions of V/J-usage, V/J-trimming, CDR3 length, and N-addition
- VDJ-C mapping
- V-J combination distributions as 2D and 3D maps
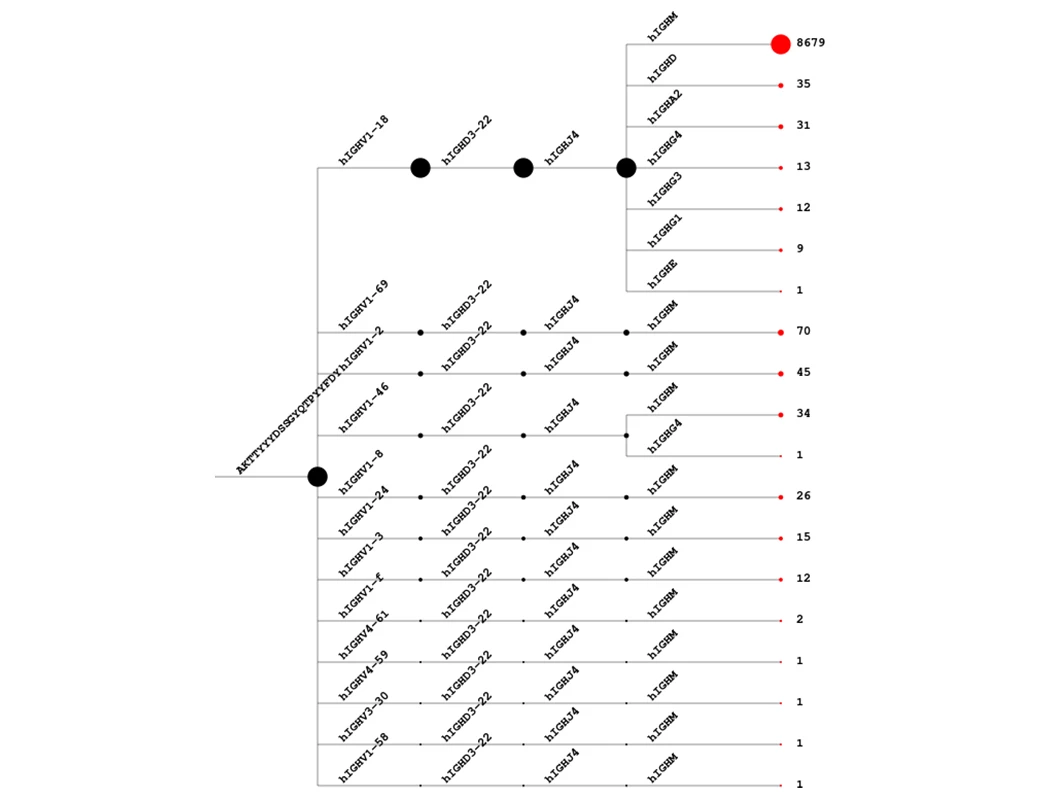
Tree maps and identification and comparison of clonotypes (hierarchical treemaps are only available in the iRweb package)

Diversity tree maps denote the relative frequency of unique V-J-uCDR3s. Each rounded rectangle represents a uCDR3, where the size denotes the relative frequency.
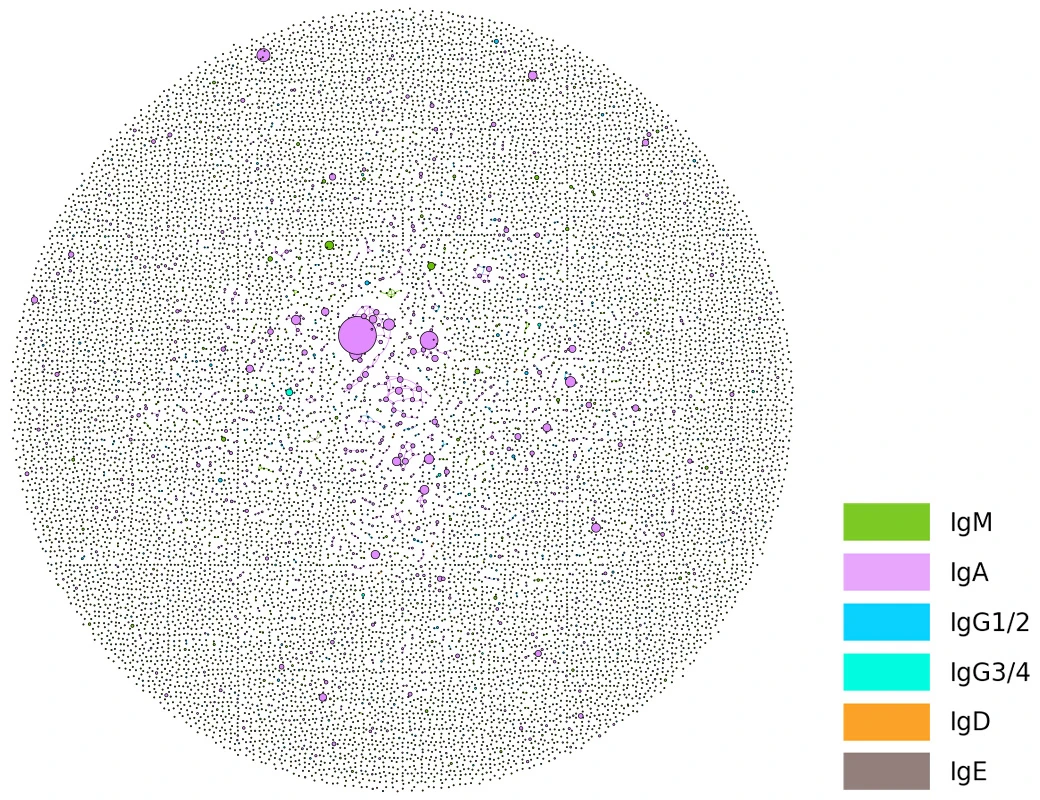
B cell network plots denote the formation of a network of CDR3 peptide sequences. The size of a node is based on RNA expression and an isotype.