SERVICES
Standard Data Analysis
Our Standard Data Analysis package provides immune response insights to drive your clinical research programs forward
The Standard Data Analysis package is included for adaptive immune receptor repertoire (AIRR) product and service orders, as well as for single-cell projects through the single cell iPair Analyzer.
Bulk VDJ Sequencing

Single Cell VDJ Sequencing

Parallel Immunophenotype Analysis

Commitment to Quality
iRepertoire’s Quality Management System adheres to GCLP standards, ensuring its innovative products and services are of the highest quality and meet or exceed customer requirements and expectations. iRepertoire’s commitment to Continual Quality Improvement (CQI) includes continuous staff training, state-of-the-art equipment, and rigidly maintained systems. These measures effectively and efficiently control product supply and project completion in a timely, accurate, coherent, relevant, and professional manner.
Our commitment includes:
- Subject Matter Expert review, from library preparation through data QC, to ensure high quality results
- A data QC pipeline to analyze the conversion of raw reads to mapped and condensed reads, which includes quality flagging
- Batch sharing analysis for flow cells to identify potential sample mis-labeling and/or cross-contamination to guarantee reliable results
- Inclusion of negative and positive control library preparations (in replicate) alongside sample batches
- Stringent QC parameters on critical reagents utilized in processing
Bulk VDJ analysis
Our standard data outputs and reports for RepSeq and RepSeq+ service and products include:
VDJ Analysis Outputs
- Alignment to reference sequences
- Downloadable demultiplexed raw or filtered data
- Molecular ID/barcode sequencing decoding
CDR Metrics
- CDR1, CDR2, and CDR3 identification
- The number of CDR3s captured in the library and the number of unique CDR3s within each sample
- CDR3 hierarchical peptide frequency mapping including class-switching for BCRs
- CDR3 peptide with V-J frequency lists
- CDR3 algebra: Different samples are scaled, so that the frequency of CDR3s can be compared across samples with differing read depths
Diversity Metrics
- D50
- Diversity index
- Shannon entropy

Diversity tree maps denote the relative frequency of unique V-J-uCDR3s. Each rounded rectangle represents a uCDR3, where the size denotes the relative frequency.

A hierarchical tree is shown for the V, D, J, and C-gene combinations that went into making a given amino acid CDR3.
Featured Service
Immunosight™
Uncover adaptive immune cell phenotypes with targeted gene amplification combined with immune repertoire sequencing data
Relevant: Essential and customizable immunophenotype content (150+ genes)
Adaptable: Compatible with single-cell and bulk-cell (PBMC, PAXgene RNA, sorted cells) and tissue (FFPE, FF)
Intuitive: Quantitative relative gene expression data presented in easy-to-interpret heat maps

Validation data were generated using colorectal tumor tissue and adjacent normal tissue, Paxgene whole blood extracted RNA, and PBMC both stimulated and unstimulated to demonstrate the difference in expression of various gene markers included in the Immunosight panel. Depicted in the left panel is the feature importance bar graph which demonstrates which genes are driving the separation of groups in the UMAP plot. On the right is the UMAP plot. As can be observed, the unstimulated cells from two different donors cluster together and the stimulated PBMC form a separate and distinct cluster despite two different types of stimulation. These clusters are distinct from both the normal and tissue CRC and Paxgene extracted RNA, which each show distinct patterns of gene expression.
Single cell VDJ analysis
iPair Analyzer
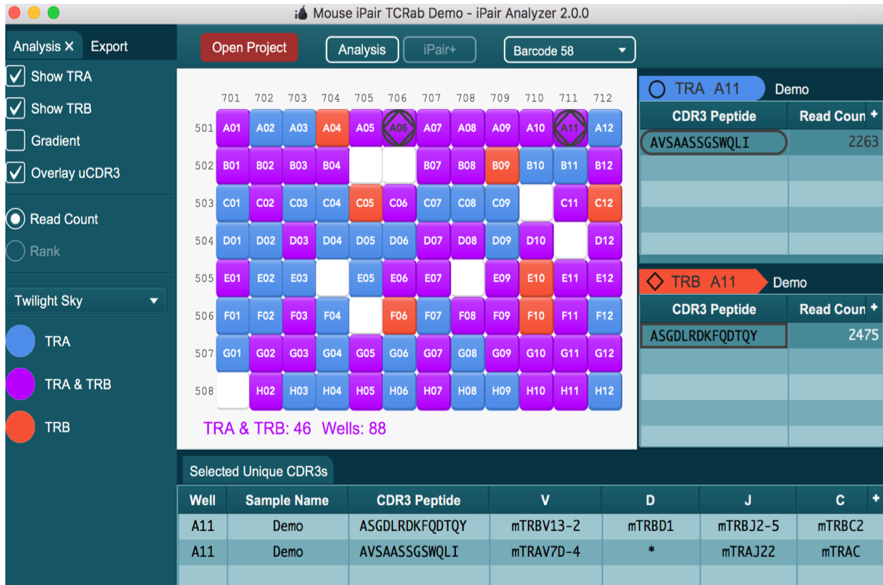
iPair Analyzer is an exclusive interactive tool that aids in the visualization of TCR and BCR paired sequencing data for individual cells and expression markers (if iPair+ Immunosight is selected)
The iPair Analyzer graphic user interface represents samples in a 96 well plate via an interactive panel. When a cell in the panel is selected, single cell BCR and TCR chain results are displayed. A worksheet feature lets you select chains of interest and further explore and compare specific nucleotide sequences.
When using iPair+, the analyzer shows a gradient based on the number of reads for each well.
iPair
- Read depth
- Unique CDR3s
- Chain usage
- V/D/J usage
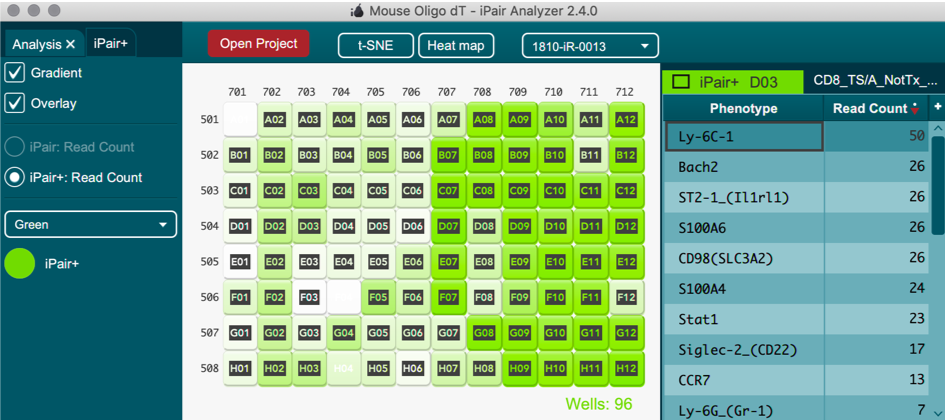
iPair+ Immunosight
iPair+ single cell phenotyping data can also be visualized in iPair analyzer via heatmaps and T-SNE plots