All of our services come with complimentary basic data analysis through our proprietary pipeline, which then outputs data to iRweb. iRweb is a web-based RepSeq bioinformatic software that allows researchers to have all of the following services and analyses performed on their samples:
- Barcode demultiplexing
- The number of CDR3s captured in the library and the number of unique CDR3s within each sample
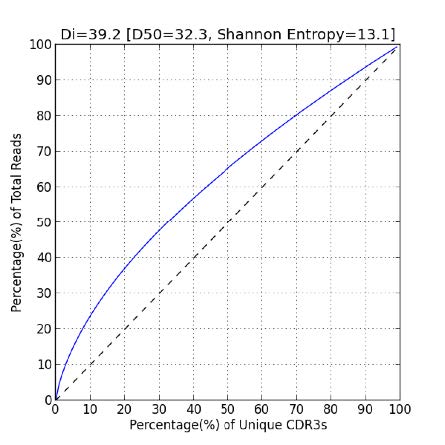
- The diversity of the immune repertoire in each sample, captured by a diversity index, a proprietary D50 value, and the Shannon entropy
- Normalized and unnormalized distributions of V/ J-usage, V/J-trimming, CDR3 length, and N-addition. (Normalization accounts for differing coverage depth by treating each unique CDR3-VDJ combination as one regardless of read count.)
- VDJ-C mapping
- Alignments to the IMGT database
- V-J combination distributions as 2-D and 3D maps
- CDR3 hierarchical peptide frequency mapping including class-switching for BCRs
- CDR3 peptide with V-J frequency lists
- CDR3 algebra: Different samples are scaled, so that the frequency of CDR3s can be compared across samples with differing read depths.
Access to iRweb and basic data analysis is also available to customers who have purchased our reagent kits, but certain rules and restrictions apply in order to avoid fees.
Learn more about iRweb and explore a demo via our Bioinformatics page.
Reports
Data can be visualized via iRweb through a variety of reports such as heat maps, tree maps, and graphical and numerical representations of diversity. Data are available as pre-rendered PDFs or JPEG files, but are also available as CSVs in case researchers would like to render graphics themselves.
Heat Maps
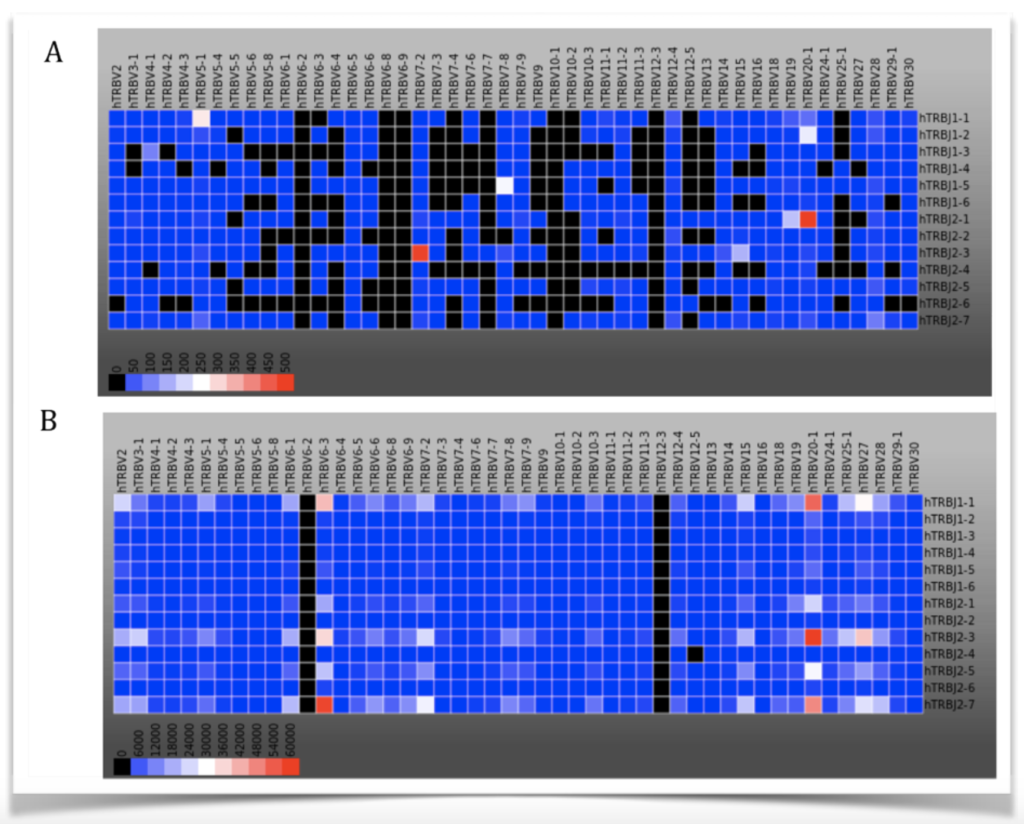
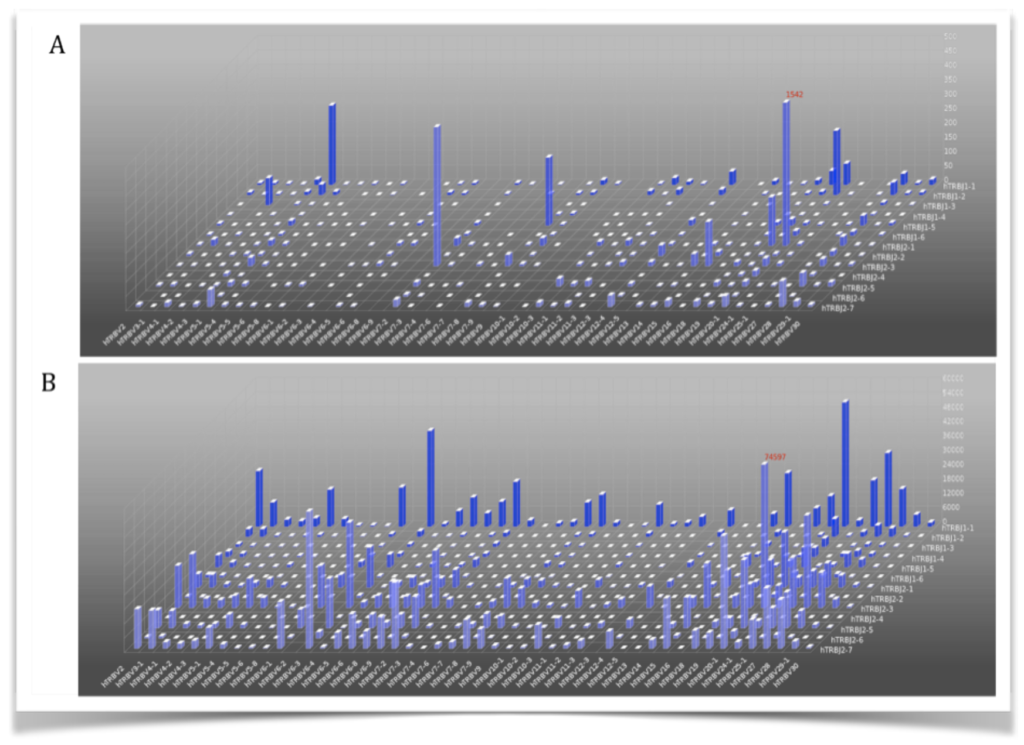
The relative frequency of different alleles within a population is shown via heat maps. For instance, you might use a heat map to visualize what T cell receptor gene variants appear most frequently in a healthy patient versus a patient with cancer. Quantitative differences in diversity (the number of different variants) are immediately obvious in 2D or 3D heat maps like the ones below.
Tree Maps
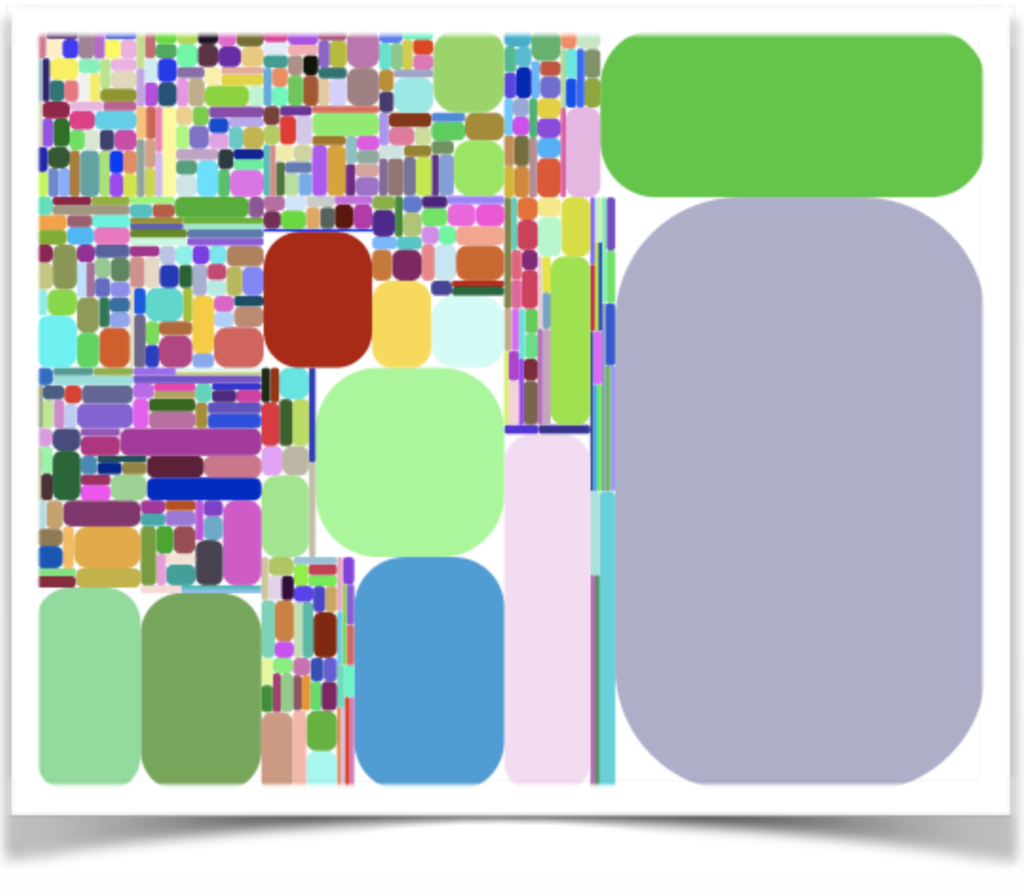
Diversity can also be shown using tree maps. Tree maps like the one below represent a variant population, in which each clonotype is represented by a different colored shape. The size of the shape reflects the frequency of the variant (i.e., a large shape represents a high frequency, or clonal expansion). Tree maps enable quick visual assessments of the relative repertoire diversity in different samples; smaller shapes and more varied colors equate to greater diversity.
Graphs
The diversity of the immune repertoire can also be captured numerically via a diversity index (Di), Shannon Entropy, and D50 value. The diversity index is a function of the frequency of each CDR3 and the total number of unique CDR3s. The Shannon entropy concerns only the top 10,000 most frequent CDR3s. The D50 is the percent of dominant and percent of unique clones that account for 50% of the total number of CDR3s in the sample. Very diverse libraries will have a D50 value close to 50. The diversity is represented by graphs like the one below in which the black dashed line represents “perfect” diversity.
iPair Analyzer
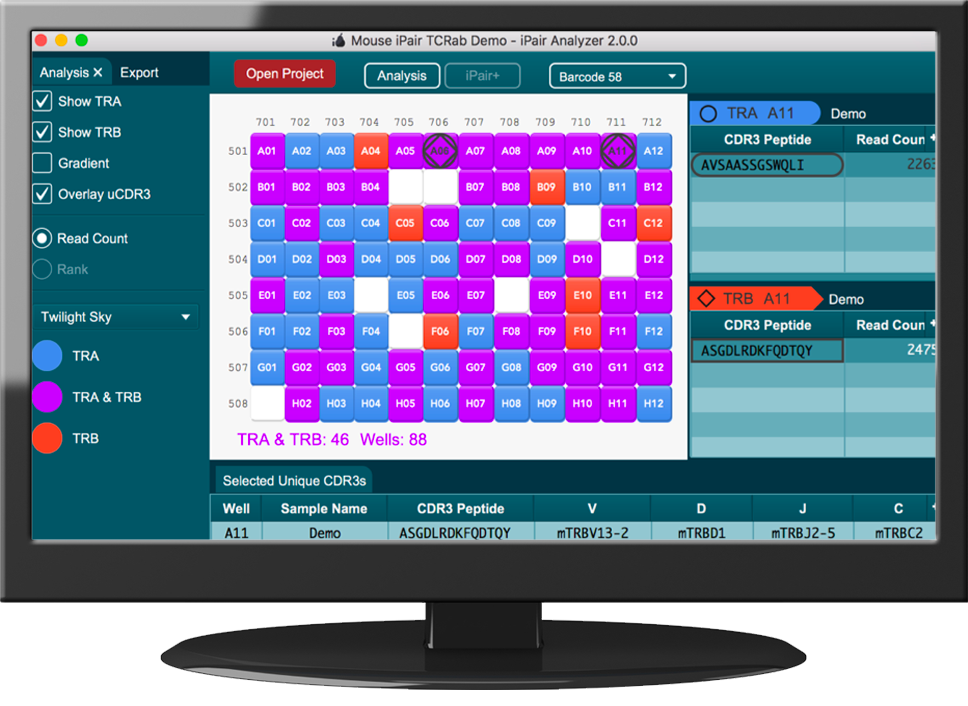
The iPair Analyzer is the data analysis platform developed for single cell repertoire sequencing data performed via our iPair service. The iPair Analyzer aids in visualization and comparison of data for single cells as well as bulk repertoires (if bulk sequencing is performed in tandem).
The iPair Analyzer’s exclusive graphic user interface represents samples in a 96 well plate in an interactive panel. Features such as read depth, chain type, or the presence of a particular unique CDR3 can be highlighted via different colors and symbols on the panel. When a cell in the panel is selected, single cell BCR or TCR chain results are displayed. A worksheet feature lets you select chains of interest and further explore and compare additional features such as the nucleotide sequence of the read, CDR1, CDR2, CDR3, V, D, and J usage.
